Basic SubPlots
In [1]:
import matplotlib.pyplot as plt
import numpy as np
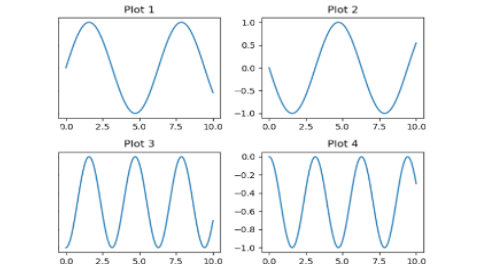
x = np.linspace(0, 10, 100)
y = np.sin(x)
fig, axs = plt.subplots(2, 2)
axs[0, 0].plot(x, y)
axs[0, 0].set_title('Plot 1')
axs[0, 1].plot(x, -y)
axs[0, 1].set_title('Plot 2')
axs[1, 0].plot(x, y**2)
axs[1, 0].set_title('Plot 3')
axs[1, 1].plot(x, -y**2)
axs[1, 1].set_title('Plot 4')
plt.tight_layout()
plt.show()

In [2]:
import matplotlib.pyplot as plt
import numpy as np

x = np.linspace(0, 10, 100)
y1 = np.sin(x)
y2 = np.cos(x)
data = np.random.randn(1000)
fig, axs = plt.subplots(2, 2, figsize=(10, 10))
axs[0, 0].plot(x, y1, label='Sine')
axs[0, 0].set_title('Line Plot')
axs[0, 0].legend()
axs[0, 1].scatter(x, y2, color='r', label='Cosine')
axs[0, 1].set_title('Scatter Plot')
axs[0, 1].legend()
axs[1, 0].hist(data, bins=30, color='g', alpha=0.7)
axs[1, 0].set_title('Histogram')
categories = ['A', 'B', 'C', 'D', 'E']
values = [5, 7, 8, 5, 6]
axs[1, 1].bar(categories, values, color='b', alpha=0.6)
axs[1, 1].set_title('Bar Chart')
fig.suptitle('Subplots with Different Charts')
plt.tight_layout(rect=[0, 0, 1, 0.96])
plt.show()
