Histogram
In [1]:
#!pip install seaborn
In [2]:
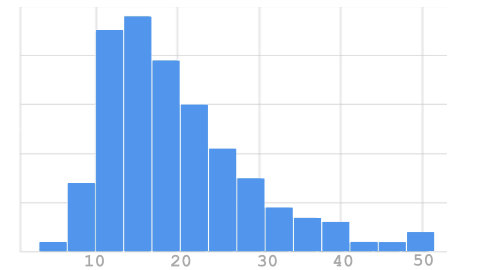
# Histogram
import seaborn as sns
import matplotlib.pyplot as plt

tips = sns.load_dataset("tips")
sns.histplot(data=tips, x="total_bill")
plt.show()

In [3]:
# Customizing the Histogram
import seaborn as sns
import matplotlib.pyplot as plt

tips = sns.load_dataset("tips")
sns.histplot(data=tips, x="total_bill", bins=30, kde=True, color='blue', edgecolor='black')
plt.xlabel('Total Bill')
plt.ylabel('Frequency')
plt.title('Histogram of Total Bill Amounts')
plt.show()
