Line Plot
In [1]:
import matplotlib.pyplot as plt

x = [1, 2, 3, 4, 5]
y = [2, 3, 8, 9, 11]

plt.plot(x, y)
plt.xlabel('X')
plt.ylabel('Y')
plt.title('Line Plot')
plt.show()

In [2]:
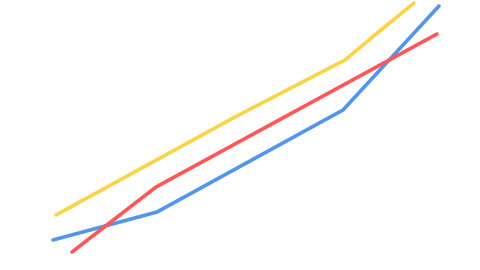
import matplotlib.pyplot as plt

x = [1, 2, 3, 4, 5]
y1 = [2, 3, 5, 7, 11]
y2 = [1, 4, 6, 8, 10]
y3 = [3, 5, 7, 9, 12]
plt.plot(x, y1, label='Series 1')
plt.plot(x, y2, label='Series 2')
plt.plot(x, y3, label='Series 3')

plt.title('Line Chart with Multiple Series')
plt.xlabel('X-axis')
plt.ylabel('Y-axis')
plt.legend()
plt.show()

In [3]:
import matplotlib.pyplot as plt

x = ['A', 'B', 'C', 'D', 'E']
y1 = [10, 15, 9, 12, 7]
y2 = [2, 3, 5, 7, 11]
fig, ax1 = plt.subplots()
ax1.bar(x, y1, color='b', alpha=0.6, label='Bar Series')
ax1.set_xlabel('Category')
ax1.set_ylabel('Bar Values', color='b')
ax1.tick_params(axis='y', labelcolor='b')
ax2 = ax1.twinx()
ax2.plot(x, y2, color='r', marker='o', label='Line Series')
ax2.set_ylabel('Line Values', color='r')
ax2.tick_params(axis='y', labelcolor='r')
plt.title('Combined Bar and Line Chart')
fig.legend(loc='upper left', bbox_to_anchor=(0.1,0.9))
plt.show()
