
Outliers
In [1]:
# Identifying Outliers Using Box Plot
import pandas as pd
import matplotlib.pyplot as plt
import seaborn as sns

df = pd.DataFrame({
    'A': [1, 2, 3, 4, 5, 100],
    'B': [10, 20, 30, 40, 50, 60]
})
df.boxplot(column=['A'])
plt.show()

In [2]:
tips = sns.load_dataset("tips")

sns.boxplot(x="day", y="total_bill", data=tips, palette="Set2", hue="day")
plt.xlabel('Day of the Week')
plt.ylabel('Total Bill')
plt.title('Boxplot of Total Bill Amounts by Day')
plt.show()

In [3]:
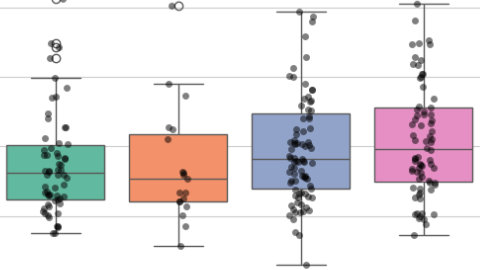
# Adding Data Points to the Boxplot
import seaborn as sns
import matplotlib.pyplot as plt

tips = sns.load_dataset("tips")
sns.boxplot(x="day", y="total_bill", data=tips, palette="Set2", hue="day")
sns.stripplot(x="day", y="total_bill", data=tips, color="black", alpha=0.5)
plt.xlabel('Day of the Week')
plt.ylabel('Total Bill')
plt.title('Boxplot of Total Bill Amounts by Day with Data Points')
plt.show()

In [4]:
# Identifying Outliers Using Z-Score
import pandas as pd
import numpy as np

df = pd.DataFrame({
    'A': [1, 2, 3, 4, 5, 100],
    'B': [10, 20, 30, 40, 50, 60]
})
df['Z_Score'] = (df['A'] - df['A'].mean()) / df['A'].std()
outliers = df[np.abs(df['Z_Score']) > 1]
print(outliers.head(30))
     A   B   Z_Score
5  100  60  2.039941
In [5]:
# Removing Outliers Using IQR
import pandas as pd

df = pd.DataFrame({
    'A': [1, 2, 3, 4, 5, 100],
    'B': [10, 20, 30, 40, 50, 60]
})
Q1 = df['A'].quantile(0.25)
Q3 = df['A'].quantile(0.75)
IQR = Q3 - Q1
lower_bound = Q1 - 1.5 * IQR
upper_bound = Q3 + 1.5 * IQR
df_no_outliers = df[(df['A'] >= lower_bound) & (df['A'] <= upper_bound)]
df_outliers = df[(df['A'] < lower_bound) | (df['A'] > upper_bound)]
print("NO Outliers")
print(df_no_outliers.head(30))
print("Outliers")
print(df_outliers.head(30))
NO Outliers
   A   B
0  1  10
1  2  20
2  3  30
3  4  40
4  5  50
Outliers
     A   B
5  100  60
In [6]:
#Replacing Outliers with Median
import pandas as pd

df = pd.DataFrame({
    'A': [1, 2, 3, 4, 5, 100],
    'B': [10, 20, 30, 40, 50, 60]
})
print(df)
Q1 = df['A'].quantile(0.25)
Q3 = df['A'].quantile(0.75)
IQR = Q3 - Q1
lower_bound = Q1 - 1.5 * IQR
upper_bound = Q3 + 1.5 * IQR
median = df['A'].median()
df['A'] = np.where((df['A'] < lower_bound) | (df['A'] > upper_bound), median, df['A'])
print("Median",median)
print("NEW")
print(df)
     A   B
0    1  10
1    2  20
2    3  30
3    4  40
4    5  50
5  100  60
Median 3.5
NEW
     A   B
0  1.0  10
1  2.0  20
2  3.0  30
3  4.0  40
4  5.0  50
5  3.5  60