Pie chart
In [1]:
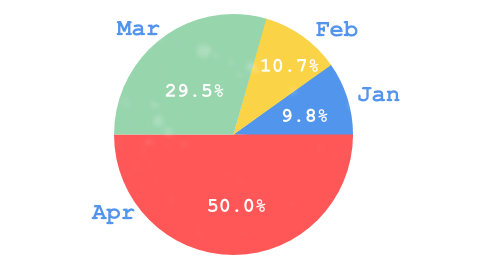
import matplotlib.pyplot as plt

sizes = [11, 12, 33, 56]
labels = ['Jan', 'Feb', 'Mar', 'Apr']

plt.pie(sizes, labels=labels, autopct='%1.1f%%')
plt.title('Pie Chart')
plt.show()

In [2]:
import matplotlib.pyplot as plt

labels = ['A', 'B', 'C', 'D', 'E']
data1 = [10, 20, 30, 20, 20]
data2 = [15, 25, 10, 30, 20]
fig, ax = plt.subplots()
ax.pie(data1, labels=labels, radius=1, wedgeprops=dict(width=0.3, edgecolor='w'), labeldistance=1.1)
ax.pie(data2, radius=0.7, wedgeprops=dict(width=0.3, edgecolor='w'))
plt.title('Donut Chart with Multiple Series')
plt.show()

In [3]:
import matplotlib.pyplot as plt

labels = ['A', 'B', 'C', 'D', 'E']
data1 = [10, 20, 30, 20, 20]
data2 = [15, 25, 10, 30, 20]
data3 = [5, 15, 25, 35, 20]
fig, (ax1, ax2, ax3) = plt.subplots(1, 3, figsize=(15, 5))
ax1.pie(data1, labels=labels, autopct='%1.1f%%', startangle=90)
ax1.set_title('Series 1')
ax2.pie(data2, labels=labels, autopct='%1.1f%%', startangle=90)
ax2.set_title('Series 2')
ax3.pie(data3, labels=labels, autopct='%1.1f%%', startangle=90)
ax3.set_title('Series 3')
plt.suptitle('Pie Charts with Multiple Series')
plt.show()
